When exploring what is Microsoft Fabric vs Power BI, it's essential to understand how these two tools differ in their core functionalities. Both are integral parts of Microsoft’s data solutions, yet they serve distinct purposes.
Power BI is a powerful tool for data visualization, helping businesses turn data into interactive reports and dashboards. In contrast, Microsoft Fabric is a comprehensive platform designed to handle the entire data lifecycle—from ingestion and transformation to storage and advanced analytics.
Centric helps businesses navigate the complexities of data solutions by providing expert guidance in selecting the right tool. In this guide, you will learn about the unique strengths of Microsoft Fabric and Power BI, and when to use each tool based on your organization's needs.
Whether you're focused on visualization, data processing, or end-to-end analytics, this comparison will help you determine the best fit for your goals.
What is Microsoft Fabric?
Microsoft Fabric is a unified data platform from Microsoft, designed to simplify and enhance data management, engineering, and science workflows. By consolidating multiple tools and services under a single umbrella, it enables organizations to handle complex data operations more efficiently.
Microsoft Fabric platform integrates with data storage, data engineering, and analytics into one cohesive platform, making it easier for businesses to manage the entire data lifecycle.
One of the key aspects of Microsoft Fabric features is its ability to support end-to-end data processes, offering businesses a comprehensive solution that spans from data ingestion to real-time analytics.
With deep integration into Microsoft Fabric cloud solutions, it leverages Azure's infrastructure to provide scalable and high-performance processing, making it an ideal choice for large enterprises dealing with massive datasets.
This all-in-one approach enhances flexibility, ensuring that businesses can maintain complete control over their data infrastructure.
Check Our Microsoft Fabric Solution
End-to-End Data Management
Microsoft Fabric supports the full data lifecycle, from data ingestion to transformation and storage. This comprehensive approach simplifies how organizations manage and prepare data for analysis.
With Microsoft Fabric capabilities, users can easily collect data from a variety of sources such as databases, APIs, or cloud storage and then clean and transform that data into a usable format.
Integration with Azure cloud services provides scalable Microsoft cloud solutions, allowing organizations to store data securely and access it quickly, even at a large scale. With its powerful data processing tools, Microsoft Fabric can manage vast amounts of data, ensuring that even the most complex data operations are handled effectively.
Real-Time Data Processing
Another standout feature of Microsoft Fabric is its ability to handle real-time data processing. This is especially crucial for businesses that rely on up-to-the-minute data to make time-sensitive decisions.
Microsoft Fabric architecture is designed to support high-throughput, low-latency data processing, ensuring data can be processed and made available for analysis almost instantly.
Whether dealing with streaming data, IoT data, or other real-time data sources, Microsoft Fabric provides the necessary infrastructure to efficiently manage and analyze this data as it is generated. The platform's real-time analytics capabilities are powered by its tight integration with Azure’s cloud services, offering flexibility and scalability to meet growing data demands.
Collaboration Features
Microsoft Fabric is built for collaboration across various roles such as data engineers, data scientists, and business analysts. The platform allows teams to work seamlessly within the same environment, enabling real-time collaboration on data cleaning, analysis, and model building.
This collaboration is facilitated by Microsoft Fabric’s ability to integrate with other Microsoft tools like Power BI, Excel, and Teams, making it easier for teams to share insights and collaborate on data-driven projects.
With these features, Microsoft Fabric helps businesses break down silos and encourages cross-functional teamwork, ensuring that all stakeholders are aligned and able to contribute effectively to the data process.
What is Power BI?
Power BI is a leading business intelligence tool from Microsoft designed to simplify the process of transforming raw data into meaningful insights. It enables businesses to visualize data through interactive reports and dashboards, allowing decision-makers to easily understand trends, performance, and key metrics.
Power BI connects to a wide range of data sources, providing a comprehensive solution for data analysis, reporting, and sharing.
One of the major Power BI capabilities is its ability to integrate with various data sources, including Excel, cloud databases, and external services. The tool empowers users to clean, transform, and model data, allowing them to craft tailored visualizations.
With the Power BI report building functionality, users can create complex reports that deliver the insights their organization needs in a clear and interactive way.
The platform also offers extensive customization for visual elements, allowing businesses to tailor dashboards that best represent their data. These visualizations are interactive, meaning that users can explore data points in more detail, making Power BI an invaluable tool for organizations looking to make data-driven decisions.
Ease of Use for Non-Technical Users
One of Power BI’s standout features is its user-friendly interface. Even for non-technical users, creating impactful reports and dashboards is straightforward, thanks to Power BI's intuitive drag-and-drop functionality.
Users can easily load data, design reports, and customize visual elements without needing to write any code. This makes it accessible to business analysts, marketers, and other professionals who may not have technical expertise but need to analyze data.
Additionally, Power BI integrates smoothly with other Microsoft tools like Excel, SharePoint, and Teams, enabling businesses to pull data directly from these platforms. This seamless integration ensures that teams working within the Microsoft ecosystem can leverage their existing data without friction, making Power BI an even more valuable tool for those already using Microsoft products.
Data Visualization and Reporting
Power BI excels in data visualization and reporting, allowing businesses to create interactive and visually appealing dashboards that highlight key insights. Users can choose from a wide array of visualizations, including bar charts, pie charts, maps, and more, all of which are highly customizable.
These reports can be shared in real time with stakeholders, ensuring everyone is aligned with the latest data insights.
The Power BI dashboard features allow users to set up custom layouts to highlight specific performance metrics, helping teams focus on what matters most. Additionally, Power BI’s interactive visualizations enable users to drill down into data, filter information, and view details, ensuring they get the answers they need with minimal effort.
Power BI also includes built-in AI and machine learning capabilities, which enhance the reporting experience by identifying trends and providing predictive insights, making it a robust tool for both basic and advanced analytics needs.
Microsoft Fabric vs Power BI: Key Differences
When deciding between Microsoft Fabric vs Power BI, understanding the core differences and functionalities of each tool is crucial for selecting the right platform for your organization. While both tools are part of Microsoft’s broader data ecosystem, they serve distinct purposes and are suited to different use cases.
Power BI is primarily focused on data visualization, allowing users to turn data into interactive reports and dashboards. It is an excellent tool for those looking for business intelligence and visual reporting.
In contrast, Microsoft Fabric is a more comprehensive platform designed to manage the entire data lifecycle—from data ingestion and transformation to storage, advanced analytics, and real-time processing.
In this section, we will explore the Microsoft Fabric vs Power BI comparison based on their scope, functionalities, integration capabilities, customization options, and overall performance to help you understand which tool best fits your specific data needs.
|
Feature |
Microsoft Fabric |
Power BI |
|
Scope and Functionality |
Comprehensive data management, engineering, and real-time processing |
Focused on data visualization and business intelligence |
|
Data Processing and Management |
Advanced data engineering, real-time processing, and complex data management |
Basic data modeling and transformation, limited data processing |
|
Integration with Azure |
Deep integration with Azure for scalable infrastructure and high-performance analytics |
Limited integration with Azure services, primarily for visualization |
|
User Interface and Learning Curve |
More complex interface, requires technical expertise for full utilization |
User-friendly, easy for non-technical users, especially for creating reports and dashboards |
|
Customization and Flexibility |
Extensive customization across data engineering workflows, machine learning, and analytics |
Customization mainly focused on reports and dashboards, limited to visualization needs |
|
Best Suited For |
Organizations with complex data workflows, large-scale data management, and collaborative teams |
Business users and teams focused on data visualization and interactive reporting |
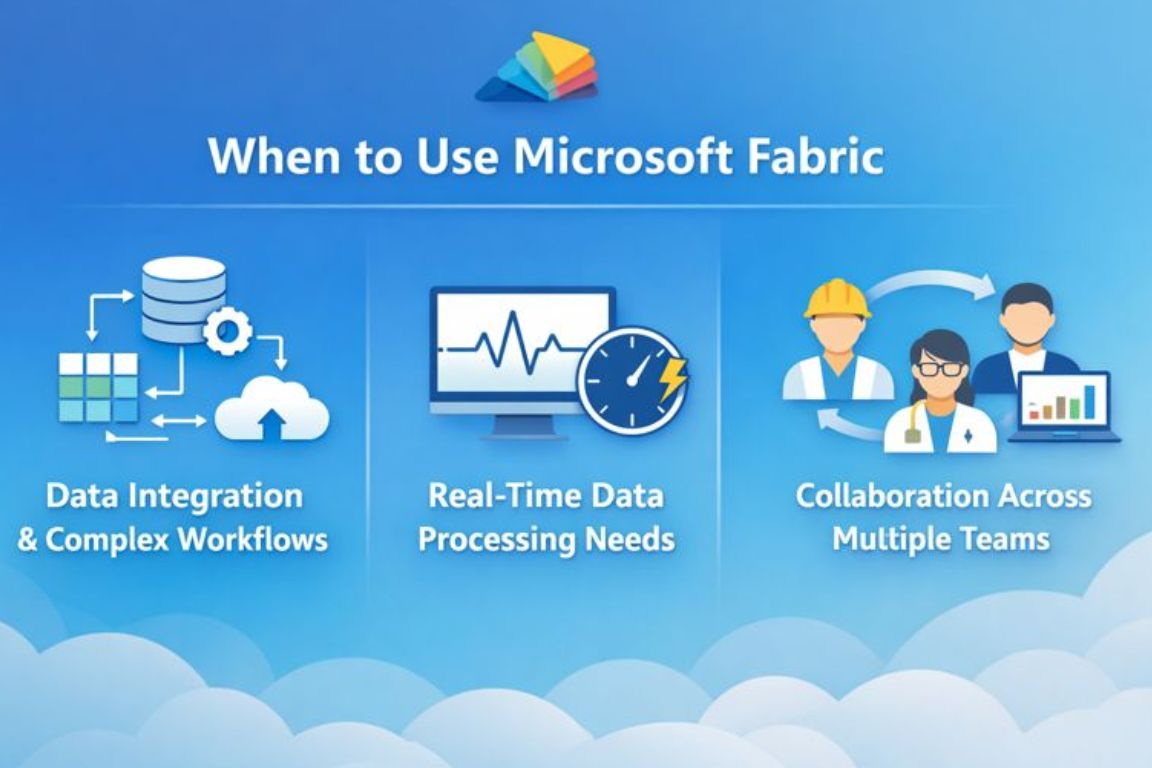
When to Use Microsoft Fabric?
Microsoft Fabric is a comprehensive data platform that serves a wide range of use cases across data engineering, data science, and analytics. It is particularly useful for organizations that need to handle large-scale data operations and require end-to-end solutions that go beyond simple data visualization.
Whether your company deals with complex data integration, needs real-time processing, or requires seamless collaboration among teams, Microsoft Fabric is designed to tackle these challenges.
Microsoft Fabric offers the flexibility and scalability needed to support complex data workflows, making it ideal for large enterprises or businesses with high demands in terms of data management and analytics.
With its integration into Azure, it provides a robust infrastructure for organizations looking to leverage advanced analytics and machine learning tools. Let’s explore when you should consider using Microsoft Fabric for your data workflows.

Data Integration and Complex Workflows
One of the primary reasons to use Microsoft Fabric is for managing and processing large datasets from various sources. If your business relies on data from different systems like SAP, Jira, or custom databases, Microsoft Fabric excels at integrating these disparate data sources into a unified platform.
This integration allows you to automate data ingestion, perform complex data transformations, and store data in a centralized, scalable environment.
When dealing with complex workflows that require data from multiple sources, Microsoft Fabric streamlines the process by offering built-in tools for data processing and transformation. This is ideal for businesses that need to automate the movement of data across various stages—from ingestion to storage and analysis—without relying on external tools or systems.
Start Your Data & Analytics Journey with Us
Real-Time Data Processing Needs
If your business needs to work with streaming data or perform real-time analytics, Microsoft Fabric is a great solution. It supports high-throughput and low-latency data processing, making it suitable for use cases such as real-time decision-making, IoT analytics, and time-sensitive business operations.
Whether you're tracking customer behavior, monitoring sensor data, or analyzing market trends as they happen, Microsoft Fabric provides the infrastructure to manage this data in real time.
The ability to perform real-time data processing and analysis ensures that businesses can act quickly on the insights they gather, providing a competitive edge in fast-paced industries. With Microsoft Fabric, you can handle data streams efficiently and scale your processing power as needed.
Collaboration Across Multiple Teams
Another key advantage of using Microsoft Fabric is its ability to facilitate collaboration across multiple teams, including data engineers, data scientists, and business analysts. The platform is designed to allow teams to work together seamlessly within the same environment, ensuring that data pipelines, models, and analytics projects are aligned and integrated.
Whether it’s data cleaning, feature engineering, or building machine learning models, Microsoft Fabric’s collaborative features enable cross-functional teams to share insights and work together more effectively.
By breaking down silos and providing a unified workspace for data professionals, Microsoft Fabric supports a more collaborative and efficient approach to data projects.
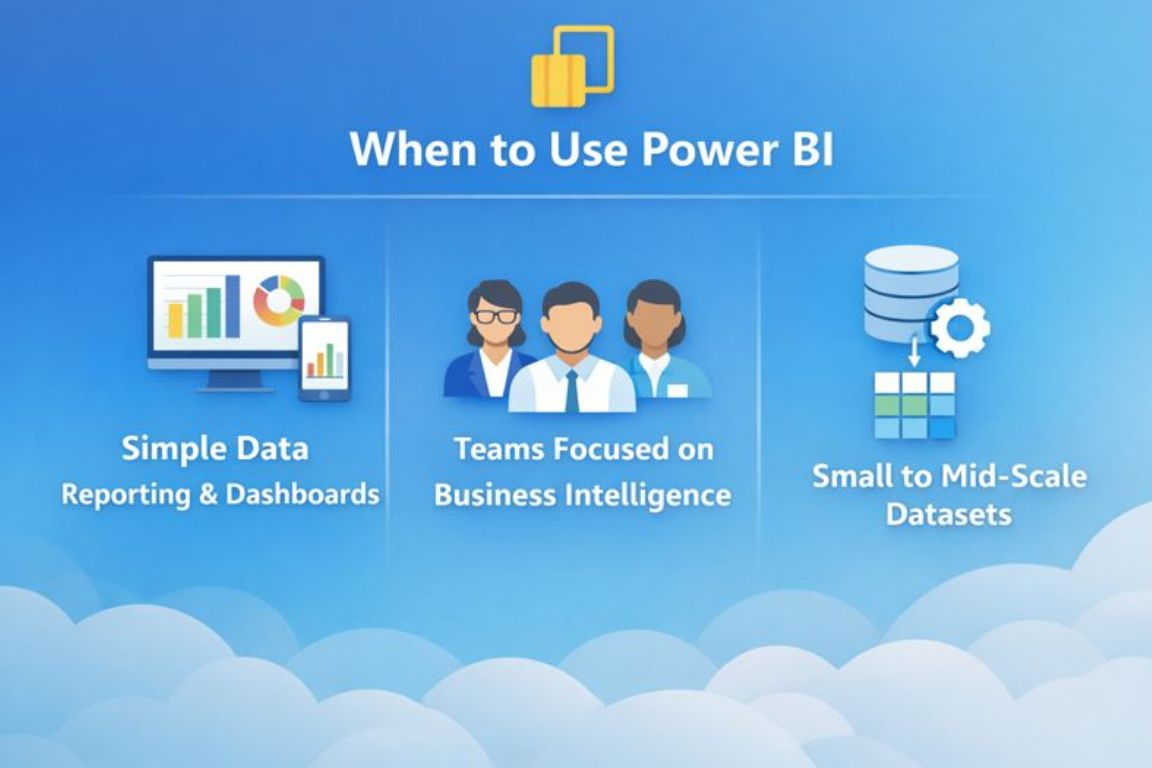
When to Use Power BI?
Power BI is a powerful tool for businesses looking to visualize and analyze data without the need for complex data processing. It is especially beneficial for teams that need to make data-driven decisions quickly and efficiently, with an emphasis on accessibility and ease of use.
Power BI’s intuitive interface and robust set of visualization features make it an ideal choice for organizations focusing on business intelligence and reporting.
Unlike more complex platforms, Power BI is designed to provide rapid insights, allowing business users and analysts to create compelling reports and dashboards with minimal effort. If your organization is looking for a simple yet effective way to turn data into visual insights without the need for extensive data engineering, Power BI may be the right solution.
Let’s explore the ideal scenarios where Power BI shines in data visualization, and when it makes sense to use it in your data workflows.
Simple Data Reporting and Dashboards
One of the best use cases for Power BI is simple data reporting and dashboard creation. Power BI enables users to quickly generate clear, actionable insights through interactive visualizations such as bar charts, pie charts, and line graphs.
Whether you're monitoring sales, tracking performance metrics, or analyzing customer engagement, Power BI’s easy-to-use interface allows business users to create compelling reports and dashboards in no time.
These reports and dashboards are designed to be accessible, providing insights without requiring deep technical expertise. With Power BI, you can automate data refreshing, ensuring that your team always has the most up-to-date information at their fingertips. This makes it perfect for businesses that need to generate and share quick insights regularly.
Teams Focused on Business Intelligence
Power BI is ideal for teams focused on business intelligence reports that want to explore and visualize data without complex data engineering tasks. It is well-suited for non-technical teams like marketing, finance, or HR, who need data-driven insights but don't necessarily have the resources or skills to use more advanced analytics platforms.
The user-friendly drag-and-drop functionality of Power BI allows these teams to create and explore reports without having to write a single line of code. By providing a direct and simple way to access data and generate visualizations, Power BI makes it easy for anyone in the organization to contribute to data analysis and make informed decisions.
Small to Mid-Scale Datasets
Another great use case for Power BI is when working with small to mid-scale datasets, typically under 100GB. For businesses that don't require complex data processing or large-scale data manipulation, Power BI offers a cost-effective and straightforward solution to visualize and report on their data.
Power BI is particularly effective when working with data from sources like Excel, SharePoint, or cloud databases, where the data volumes are manageable. It enables businesses to quickly turn data into valuable insights with minimal setup.
However, as data size and complexity grow beyond this range, businesses may need to consider additional solutions or platforms like Microsoft Fabric for more robust data processing and scalability.
How Microsoft Fabric and Power BI Work Together?
Microsoft Fabric and Power BI complement each other to create an integrated data ecosystem. While Power BI excels in visualization, Microsoft Fabric manages the backend, handling data preparation, processing, and storage. Together, they provide a comprehensive solution for data management and reporting.
The Data Flow Process
Microsoft Fabric handles the complex tasks of data preparation and cleaning, transforming raw data into a usable format. Once the data is processed and structured, Power BI steps in to visualize the cleaned data, making it easy for users to interpret and make decisions based on insights.
Real-World Example
A retail company might use Microsoft Fabric to aggregate and clean data from various sales platforms, supply chains, and customer databases. Power BI would then visualize this cleaned data, creating actionable dashboards for executives to monitor sales performance, inventory levels, and customer behavior in real time.
FAQs
What is the main difference between Microsoft Fabric and Power BI?
The main difference is scope. Power BI focuses on data visualization and reporting, while Microsoft Fabric manages the entire data lifecycle. Fabric handles data ingestion, processing, storage, and analytics, whereas Power BI consumes prepared data to create interactive dashboards and reports.
Can Microsoft Fabric replace Power BI completely?
No, Microsoft Fabric does not replace Power BI. Instead, Power BI is a core component within Fabric. Fabric prepares and processes data, while Power BI visualizes it. They are designed to work together rather than function as competing tools.
When should a business choose Power BI instead of Microsoft Fabric?
A business should choose Power BI when the primary need is reporting and dashboards without complex data engineering. Power BI suits non-technical teams, smaller datasets, and organizations that want quick insights without managing large-scale data processing workflows.
Is Microsoft Fabric suitable for real-time and large-scale data analytics?
Yes, Microsoft Fabric is well-suited for real-time analytics and complex data workflows. It supports streaming data, advanced data engineering, and scalable cloud processing through Azure. This makes it ideal for organizations handling high data volumes and time-sensitive analytics.
Conclusion
Understanding what is Microsoft Fabric vs Power BI comes down to knowing your data needs and business goals. Both tools play important roles in Microsoft’s data ecosystem, but they solve different problems.
Power BI focuses on turning data into clear, interactive reports and dashboards, making it ideal for business intelligence and day-to-day reporting. Microsoft Fabric, on the other hand, supports the full data lifecycle, handling data ingestion, processing, storage, and advanced analytics.
For businesses working with simple reporting needs, smaller datasets, and non-technical teams, Power BI is often the right choice. Organizations managing complex data workflows, real-time analytics, or multiple data sources benefit more from Microsoft Fabric.
Centric helps businesses assess these requirements and design data solutions that fit their scale and objectives. Choosing the right tool depends on how much data you manage, how fast insights are needed, and how advanced your analytics workflows are.