What is Quantitative Data, and why should businesses care about it? Quantitative data refers to information that can be measured and expressed in numerical terms, such as sales figures, customer traffic, or operational performance. In today’s data-driven world, understanding and utilizing this type of data is critical for making informed decisions that drive business Wgrowth.
Centric excels in empowering businesses to leverage quantitative data, enabling them to refine strategies, enhance customer experiences, and drive overall performance. By integrating data-driven insights into their operations, businesses can make precise, evidence-based decisions that fuel success.
In this guide, you’ll learn how to define quantitative data, explore its types and collection methods, and understand how it can be analyzed to gain valuable insights. You’ll also discover the importance of quantitative data in various aspects of business.
What is Quantitative Data: A Closer Look
Quantitative data refers to information that can be expressed in numbers or quantities. It is typically measurable and used for statistical analysis, allowing businesses and researchers to make data-driven decisions. The reliance on numbers makes this type of data objective and precise, offering a clear foundation for analysis.
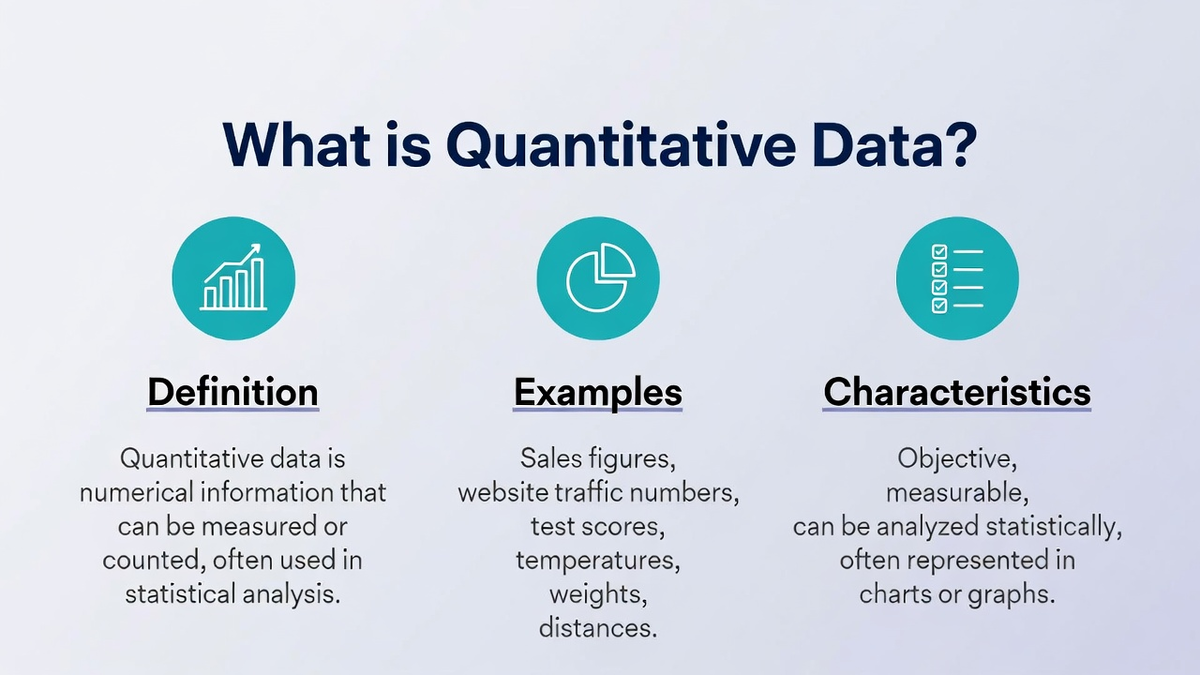
Whether it's sales figures, customer interactions, or market share, quantitative data is at the heart of performance tracking and forecasting. It is widely used across various industries such as marketing, finance, and research to quantify aspects of business operations, customer behavior, and market trends.
In contrast, qualitative data involves non-numerical information, often subjective, like opinions or experiences. While quantitative data focuses on measurable aspects, qualitative data provides context and deeper understanding. The combination of both allows businesses to get a well-rounded view of their operations, creating a comprehensive approach to decision-making.
The Basics of Quantitative Data
In simple terms, quantitative data consists of measurable, numerical data that can be used for statistical analysis, forecasting, and decision-making in business operations. It’s collected through various methods like surveys, transactions, and market observations, which result in data that can be counted, quantified, and analyzed mathematically.
Examples of Quantitative Data include figures like revenue, customer acquisition rates, or the number of products sold in a given period. These values are often presented in the form of charts, graphs, or tables to help decision-makers quickly interpret and act upon the data.
With collecting quantitative data, businesses can track performance, measure growth, and spot trends, enabling them to make informed, objective decisions.
Quantitative Data vs. Qualitative Data
The main distinction between quantitative data and qualitative data lies in the nature of the information they provide. Quantitative data is numeric and can be measured and analyzed mathematically, such as the number of customers, website traffic, or sales growth. These metrics provide clear, actionable insights that help businesses assess performance and set goals.
On the other hand, qualitative data is descriptive, focusing on qualities or characteristics that cannot be easily quantified. For example, customer feedback in the form of open-ended survey responses or interviews provides insights into the customer experience, motivations, and opinions.
While quantitative data is essential for measuring results and identifying trends, qualitative data offers context and depth, making it invaluable for understanding the “why” behind the numbers.
Both types of data play an integral role in collecting quantitative data for a holistic view of business operations, market conditions, and customer behavior. Together, they help businesses make well-informed, strategic decisions that drive growth and success.
Importance of Quantitative Data in Business
The Importance of Quantitative Data in business is paramount for providing objective, actionable insights that are essential for informed decision-making. By offering a clear, measurable view of business performance, it helps companies track success, optimize strategies, and make predictions.
Accurate quantitative data allows businesses to measure success, identify trends, and set goals, making it an essential tool for driving growth and improving performance in a competitive landscape.
The Role of Quantitative Data in Market Research
Quantitative data plays a crucial role in market research by enabling businesses to understand key metrics such as customer preferences, market demand, and sales trends. By collecting data through surveys and customer feedback, companies can accurately assess the performance of their products and services.
This data-driven approach allows businesses to identify target audiences, tailor marketing tactics, and predict future trends, ensuring the success of marketing campaigns and product launches.
Uncovering Business Insights with Quantitative Data
Quantitative data helps businesses uncover valuable insights by analyzing measurable metrics like sales figures, conversion rates, and customer behavior. By identifying patterns and performance gaps, companies can determine what’s working and what’s not. s
This data-driven approach enables businesses to refine their strategies, optimize operations, and improve customer satisfaction. Quantitative data provides the necessary tools for continuous improvement and ensures that businesses stay competitive by measuring the success of their strategies and campaigns.
2 Types of Quantitative Data
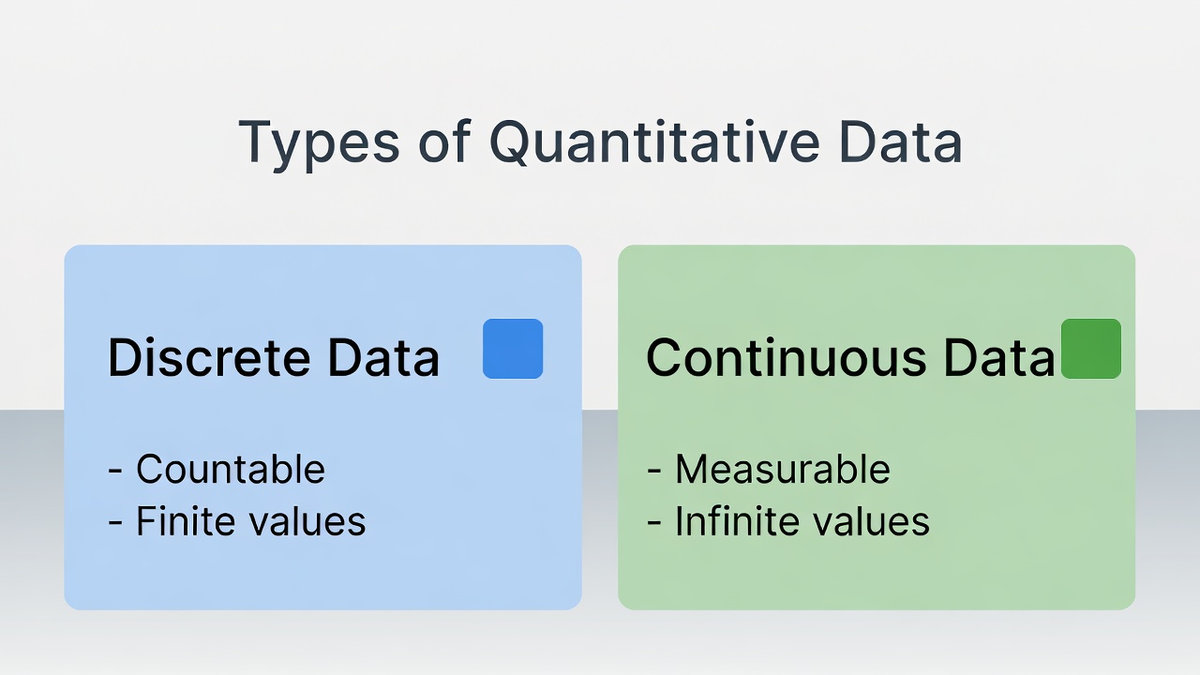
Understanding the different types of Quantitative Data is essential for effectively analyzing and interpreting data in business and research. Quantitative data is typically categorized into two main types: discrete data and continuous data.
Each type offers unique insights and is used in various scenarios depending on the business needs. Knowing the distinction between these two types helps organizations determine how to collect and analyze the data most effectively for decision-making.
1. Discrete Data
Discrete data refers to data that can only take specific, distinct values. These values are countable and do not have intermediate values. For example, the number of sales, website visitors, or customer complaints are all examples of discrete data.
Each of these values is an integer and can be counted or measured in whole numbers, making it easy to quantify and analyze. Discrete data is often represented in bar charts or pie charts for clear visualization, helping businesses track and analyze performance over time.
2. Continuous Data
Continuous data is data that can take any value within a specified range. Unlike discrete data, continuous data can be infinitely subdivided and measured over time. Examples include website traffic, temperature, or time spent on a page. These values can be represented as decimals, allowing for a higher level of precision.
Continuous data is often used to measure dynamic factors that change over time and is typically analyzed through line graphs or histograms, providing businesses with insights into trends and patterns over time.
Understanding the distinction between discrete and continuous data in the context of the types of Quantitative Data helps businesses tailor their data collection and analysis methods to achieve more accurate, actionable insights.
How Quantitative Data is Collected?
Quantitative data collection methods provide businesses and researchers with precise, measurable insights essential for decision-making. These methods ensure that data is accurate, consistent, and can be effectively analyzed.
From structured surveys to observational techniques and transactional records, each method plays a crucial role in providing actionable insights. Let’s explore the primary ways in which quantitative data is gathered in research and business.
Surveys
Surveys are a primary tool for collecting quantitative data, involving structured questions with predefined answers. These responses are numerical and easy to analyze, allowing businesses to gather insights quickly from a large audience.
Surveys can be distributed online, via email, or in person, making them highly adaptable for different research goals. They help measure customer satisfaction, product feedback, and market trends, contributing significantly to business decisions.
Observational Methods
Observational methods involve collecting quantitative data by observing specific behaviors in structured settings, such as tracking customer interactions or measuring performance metrics. Businesses use this method to gather real-time data on customer actions, such as time spent on a website or interactions with certain products.
This data is recorded numerically and provides insights into customer behavior and preferences, making it an essential tool for improving service and refining strategies.

Transactional Data
Transactional data is generated from business transactions, such as purchases, website interactions, or customer service engagements. It offers valuable insights into customer behavior, purchase patterns, and operational performance.
By analyzing transactional data, businesses can track product sales, monitor customer interactions, and identify trends over time. This type of data is vital for business optimization, helping companies refine marketing strategies and improve customer engagement for better results.
Analyzing Quantitative Data
Properly analyzing quantitative data is essential for making informed decisions and gaining valuable insights from raw data. Without accurate analysis, businesses risk misinterpreting data and making poor decisions.
Quantitative data analysis methods such as descriptive statistics, inferential statistics, and data visualization play a crucial role in summarizing, interpreting, and presenting data. These methods help businesses make sense of vast amounts of data, ensuring they can act on it effectively and strategically.
Descriptive Statistics
Descriptive statistics provide a way to summarize and describe the main features of a dataset. This includes measures such as the mean, median, and mode, which help businesses understand central tendencies in the data.
For instance, the mean is used to find the average value, while the median provides the middle value, and the mode identifies the most frequent value. These measures allow businesses to quickly grasp patterns and trends in quantitative data, aiding in effective decision-making and strategic planning.
Inferential Statistics
Inferential statistics allow businesses to draw conclusions about a larger population based on a sample of data. By using methods such as hypothesis testing, regression analysis, and confidence intervals, businesses can make predictions and decisions with a higher degree of certainty.
This type of analysis is critical when it’s not feasible to gather data from an entire population. By applying quantitative data analysis methods, businesses can estimate trends, test theories, and assess relationships between variables, helping them make informed, data-driven decisions.
Data Visualization
Data visualization plays a vital role in presenting quantitative data in an accessible and understandable format. Using tools like graphs, charts, and dashboards, data can be visualized to reveal trends, patterns, and insights at a glance.
Data visualization simplifies complex data sets, allowing decision-makers to see key points clearly and make faster, more effective decisions. Whether it’s using bar charts for comparisons or line graphs for trends over time, visualizing quantitative data ensures businesses can effectively communicate insights across teams and stakeholders.
3 Applications of Quantitative Data
Quantitative data is widely used across industries to inform decisions and optimize strategies. By providing measurable insights, businesses can improve performance, manage resources effectively, and make data-driven decisions. Let’s explore how quantitative data is applied in marketing, banking and finance, and product development to achieve business goals.
1. Quantitative Data in Marketing
In marketing, quantitative data helps businesses track campaign success, customer acquisition, and performance optimization. By analyzing metrics such as conversion rates and customer retention, marketers can refine their strategies, allocate budgets efficiently, and enhance customer targeting to increase return on investment (ROI) and maximize marketing efforts.
2. Quantitative Data in Finance
In finance, quantitative data drives decision-making for budgeting, forecasting, and investment strategies. It helps businesses assess key financial metrics like ROI, profit margins, and risk levels, ensuring accurate financial analysis. With quantitative data, companies can make informed decisions, minimize financial risk, and ensure long-term stability.
3. Quantitative Data in Product Development
Quantitative data guides product development by identifying customer preferences, evaluating satisfaction, and determining market demand. Businesses can analyze usage data, feedback, and competitor performance to design products that meet customer needs, ensuring the success of product launches and optimizing future iterations for maximum impact in the market.
3 Challenges in Using Quantitative Data
While quantitative data provides valuable insights, businesses often face challenges when working with it. The effectiveness of quantitative data analysis can be compromised by issues such as data quality, overload, and lack of context. Addressing these challenges is essential for making the most of quantitative data in decision-making.
1. Data Quality and Accuracy
The accuracy of quantitative data is critical for reliable decision-making. Inaccurate or incomplete data can lead to flawed conclusions, which may impact business strategies. Common challenges include biased data from poorly designed surveys or inaccurate data entry. Ensuring high-quality, error-free data is essential for making informed, effective decisions.
2. Data Overload
With the increasing amount of data available, businesses often face data overload, where large volumes of quantitative data become difficult to manage and analyze. This can lead to analysis paralysis, where decision-makers struggle to prioritize key insights. Implementing proper data management systems and tools is essential to avoid overwhelming teams and ensure effective analysis.
3. Limited Context
While quantitative data is valuable for its measurable nature, it may lack the context needed for comprehensive understanding. Qualitative data often provides the depth and reasoning behind numbers, which quantitative data alone cannot explain. Without this context, interpreting quantitative data may lead to incomplete or misleading insights, limiting its utility.
FAQs
What is quantitative data, and why is it important for businesses?
Quantitative data refers to numerical information that can be measured and analyzed. It’s essential for businesses as it helps track performance, measure success, and make data-driven decisions. By providing clear insights, it enables companies to optimize strategies, drive growth, and assess market trends effectively.
How is quantitative data collected?
Quantitative data is typically collected through surveys, observations, and transactional data. Surveys gather numerical responses, while observations record measurable behaviors. Transactional data, such as purchases or website interactions, provides real-time insights into customer behavior and business performance, helping organizations make informed decisions.
How does quantitative data differ from qualitative data?
Quantitative data involves measurable, numerical values, while qualitative data focuses on descriptive, non-numerical insights like opinions and experiences. While quantitative data helps businesses track measurable outcomes, qualitative data provides context, understanding motivations, and emotional responses behind customer behaviors or market trends.
How can businesses improve the accuracy of their quantitative data?
To improve the accuracy of quantitative data, businesses should implement rigorous data collection methods, use reliable tools for analysis, and regularly clean and validate data to remove errors. Proper training for staff involved in data collection also ensures more accurate, actionable data for decision-making.
Conclusion
What is quantitative data, and why is it essential for businesses? This type of data, characterized by measurable and numerical values, plays a pivotal role in business research and decision-making. It provides objective insights that help businesses track performance, optimize strategies, and make informed decisions.
From market research to product development and financial analysis, quantitative data is invaluable in driving growth and improving efficiency.
However, businesses must also address challenges such as data accuracy, overload, and context to maximize the value of quantitative data. Centric specializes in helping businesses harness both quantitative and qualitative data to develop well-rounded, data-driven strategies.
By combining these insights, Centric ensures that businesses have a comprehensive understanding of their market, operations, and customer behavior, leading to more effective decision-making and long-term success.