Curious about how to find the range of a data set? Let’s dive in and explore!
Understanding the range is essential in statistical analysis as it helps summarize the spread of data, providing insight into the variability within a data set.
Whether you're analyzing sales figures, test scores, or any other type of data, the range gives a quick overview of the difference between the highest and lowest values, which is key to interpreting trends and patterns.
At Centric , we leverage data-driven insights to help businesses make informed decisions and optimize their strategies.
This blog will walk you through the process of calculating the range, its importance, and some alternative measures of data spread like IQR, variance, and standard deviation.
What is the Range of a Data Set?
The range of a data set is a statistical measure that quantifies the spread of the data by calculating the difference between the maximum and minimum values in the set.
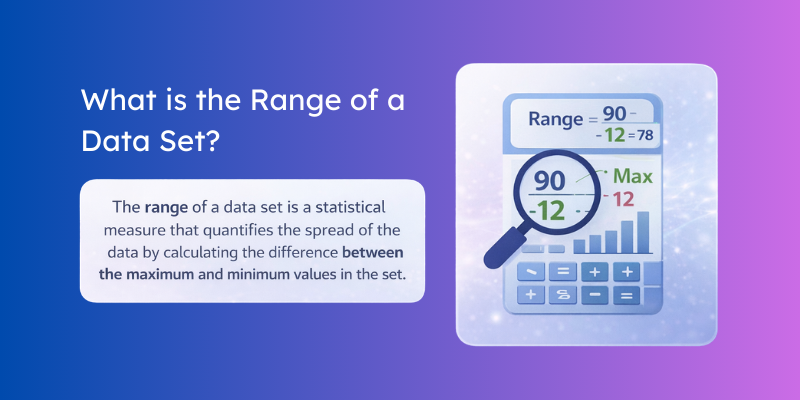
Specifically, it is found by subtracting the smallest value (minimum) from the largest value (maximum) in the data set. The formula for the range is:
Why is the Range an Important Measure in Statistics?
The range is an essential measure in statistics because it offers a quick snapshot of how spread out the values in a data set are.
-
Quick Measure of Variability: It quickly shows the spread of data, indicating if values are clustered or spread out.
-
Identifies the Extent of Data: Provides a snapshot of the highest and lowest values, revealing the range of the data.
-
Helps Spot Outliers: A large range may signal outliers, while a small range indicates consistency.
-
Initial Step for Analysis: It's a basic starting point for analyzing data before using more advanced measures.
-
Simple Calculation: Easy to compute without complex math or deep statistical knowledge.
-
Useful for Comparisons: Helps compare datasets with similar spread, but further analysis may be needed.
-
Insight into Distribution Shape: It offers a clue about whether more detailed analysis is needed, such as with standard deviation or IQR.
Why is the Range Important?
The range is a fundamental statistical tool that helps us understand the distribution of data within a set.
By calculating the difference between the highest and lowest values, the range provides an immediate sense of how widely data points are spread out. This helps identify whether the data is concentrated around a central value or if there’s a significant disparity in the values.
Quick Overview of How the Range Helps in Understanding Data Distribution
The range is particularly useful in the following ways:
-
Identifying Spread: A wide range shows high variability, while a narrow range indicates data points are closely grouped.
-
Simplifying Data Analysis: It’s a quick way to assess variation before diving into more complex measures like standard deviation.
-
Highlighting Variability: A larger range suggests more fluctuation in the data, while a smaller range indicates less variation.
3 Practical Applications in Business and Data Analysis
In business and data analysis, the range is frequently used to help interpret and make decisions based on data.
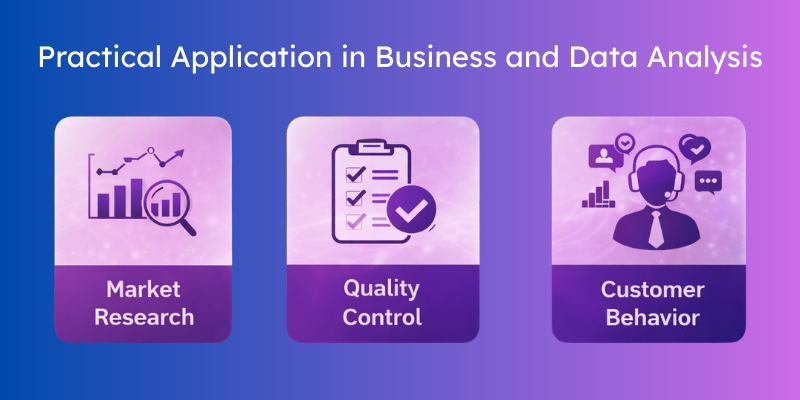
Some practical applications include:
-
Market Research: The range helps businesses understand price variability, sales volumes, or customer preferences. For example, knowing the range of product prices in a market allows businesses to determine their competitive pricing strategy.
-
Quality Control: In manufacturing, the range of measurements like product dimensions or production times can help identify consistency or detect any anomalies. A narrow range in production times indicates that the manufacturing process is stable, while a wide range might signal inefficiencies.
-
Risk Analysis: In banking and financial, the range of stock prices or returns helps investors understand the level of risk involved in a particular asset or market.
- Customer Behavior: Understanding the range of customer behaviors, such as the range of purchase amounts or engagement levels, helps businesses tailor their marketing strategies.
How to Calculate the Range: Step-by-Step
Understanding how to calculate the range in statistics is straightforward once you follow a few basic steps.
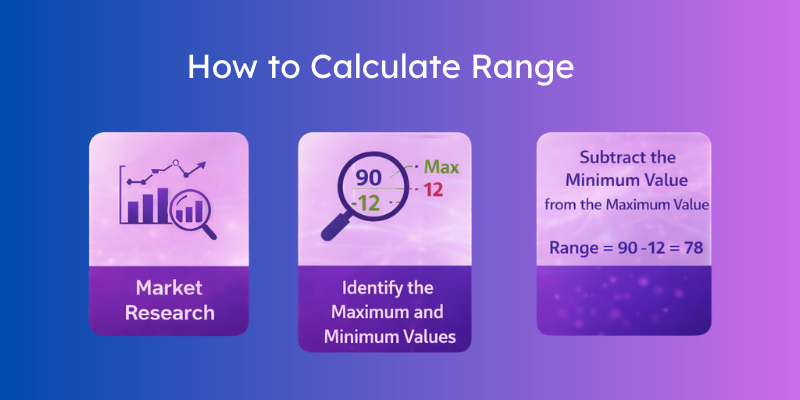
The range of a data set tells you how spread out your values are by showing the difference between the highest and lowest numbers.
It’s one of the simplest measures of data dispersion and a foundational concept in statistics and data analysis.
1. Organize Your Data
Before doing any calculations, it’s important to put your data in order:
-
Sort the data in ascending order (from lowest to highest).
-
Arranging the values first helps you clearly identify the smallest (minimum) and largest (maximum) numbers in the data set.
-
Organizing your data also makes calculating other measures like median or mode easier later on.

2. Identify the Maximum and Minimum Values
Once your data is organized:
-
Find the highest number — this is your maximum value.
-
Find the lowest number — this is your minimum value.
These two values are crucial because the entire data set range calculation depends on accurately identifying them.
3. Subtract the Minimum Value from the Maximum Value
Now that you have the minimum and maximum:
-
Apply the range formula
-
Range = Maximum value − Minimum value
This subtraction gives you a numeric value that represents how far apart the data points are.
Limitations of Using the Range
Relying solely on the range can sometimes be misleading because it only looks at the extremes of the data the maximum and minimum values and ignores everything in between.
Although the range in statistics is one of the simplest ways to describe how spread out a data set is, it doesn’t always tell the full story of the data’s variability.
Because the range only looks at the highest and lowest values, it ignores everything in between, and this can lead to misleading interpretations of how the data behaves overall.
Here’s why relying on the range alone might not give you a complete or accurate understanding:
-
Sensitive to Outliers: Extreme values can significantly distort the range, giving a misleading impression of data variability.
-
Ignores Data Distribution: It only considers the highest and lowest values, not the spread of values in between.
-
Not Representative of Central Tendency: The range doesn’t reflect the overall trend or central tendency of the data, like the mean or median.
-
Limited Use for Large Datasets: In large datasets, the range may not provide enough information about data variability.
-
Lacks Detail on Consistency: It doesn’t give insight into how consistent the data is across the entire set.
2 Alternative Measures of Spread
While the range is a useful first step in understanding how spread out data points are, it is not the most detailed or reliable measure, especially for data with extreme outliers.
To gain a more complete picture of the variability within a data set, statisticians often turn to other measures of spread such as variance, standard deviation, and the interquartile range (IQR).
1. Variance and Standard Deviation
Variance shows how much data points differ from the mean, while standard deviation is its square root, in the same units as the data.
Unlike the range, both measures consider all data points, providing a more detailed view of spread. They are less sensitive to outliers and offer a more reliable measure of variability.
2. Interquartile Range (IQR)
IQR measures the spread of the middle 50% of the data, ignoring outliers. It is a better alternative to the range when outliers are present, providing a more accurate picture of the data’s typical spread.
For example, in the data set [1, 2, 3, 4, 5, 100], the IQR focuses on values between Q1 and Q3, ignoring the outlier (100).
Conclusion
Now that you understand how to find the range of a data set, let's conclude.
Understanding how to calculate the range is a fundamental skill in data analysis. It helps provide a quick snapshot of the spread of values within a dataset, allowing you to identify potential outliers and gauge the variability of the data.
While the range is a simple and effective measure, it’s important to remember that it doesn't offer the full picture and should be used alongside other measures like variance, standard deviation, and IQR for deeper insights.
At Centric, we leverage data-driven strategies to help businesses unlock valuable insights and make informed decisions.
By mastering the range calculation and other statistical tools, we guide organizations in optimizing their data analysis processes and driving impactful decision-making strategies.